Enhanced Coordinate Map:
You can create beautiful maps based on geo-spatial data from your Elasticsearch indices. Additionally, you can also overlay layers from other indices that contain spatial information, from tile servers, or from Map Services (WFS). Such maps can then be added to dashboards, where they become fully interactive visualisations, allowing users to geographically view and filter data, or even add new data by simply dragging other dashboards into the map.
Enhanced Coordinate Map is a Siren visualisation that displays an aggregation and Geo Filter layers by default. The Aggregation layer is a representation of an Elasticsearch geohash aggregation bucket, while the GeoFilters layer represents the extent of filters which are applied to the Aggregation layer.
Enhanced Coordinate map can be used to view spatial information from one or more indices as layers on the map. Data is filtered the same way as other visualisations (for Aggregation and POI layer types) on the dashboard.
These dashboard filters are applied to aggregated data originated in Elasticsearch. Layers from WFS, or stored layer sources are externally managed. However, these layers are useful as a way to provide context about other relevant information during the investigation.
We can enhance the aggregated data by providing additional context with base layers (WMS/WMTS/XYZ) mapping services). For example, by configuring base maps with roads, satellite views, or a hybrid from sources such as Google, Bing, or OpenStreetMap. Vector overlays (from WFS/ or Stored layers) can also be configured.
Let’s start by configuring our first tile server, this is the base tile server that will be visible even if your map contains no other WMS/XYZ tile layer. Then later, we will also provide insight for loading and visualising the Stored Layers in Enhance Coordinate Map.
Configuring the Map with Tile Server in Siren:
We will use the ESRI world street map as an example. Of Course, you can configure Investigate to use your own tile service depending on your requirement! You can also use existing free or paid tilemap providers, or build and serve your own tilemap tiles.
The most relevant aspect is: if your tile server supports WMS/WMTS/XYZ, it is compatible with Siren Investigate.
It is possible to configure the tilemap settings directly in the investigate.yml file by adding the below configuration in it:
#map Configuration
tilemap:
  url: "https://server.arcgisonline.com/ArcGIS/rest/services/NatGeo_World_Map/MapServer/tile/{z}/{y}/{x}"
  options:
    attribution: 'Tiles © Esri — National Geographic, Esri, DeLorme, NAVTEQ, UNEP-WCMC, USGS, NASA, ESA, METI, NRCAN, GEBCO, NOAA, iPC'
    subdomains: ['a']
    minZoom: 0
    maxZoom: 16
![]()

Stored Layers:
There are two methods for loading the GeoJSON files into Elasticsearch. These are the Folder Structure and the Spatial Path methods. Both will accept files of type JSONor GeoJSON. The methods differ in how their spatial_path is determined.
We will be using the Folder Structure in this example.
Load GeoJSON into the Elasticsearch:
-
Download a GeoJSON file. We are using the populated places simple GeoJSON to load into a map.
-
Create a folder structure and place the downloaded GeoJSON into it:

-
The script to ingest GeoJSONs can be executed from the Siren Investigate folder. There are configurable arguments and the command below will log them to the console:
`bin/load_map_reference_indices.sh --help` -
For our example, run the command below to load GeoJSON into the Elasticsearch:
/bin/load_map_reference_indices.sh -p "/home/..../siren-platform-demo-data-12.0.2-linux-x86_64/geojson/" --debug --structure --overwrite
The -p argument is the path to the GeoJSON folder and is required. Argument details are here. The console output below is a successful file load (with --debug argument) to Elasticsearch.

Add layers button and visualize the stored layers in enhanced coordinate map:
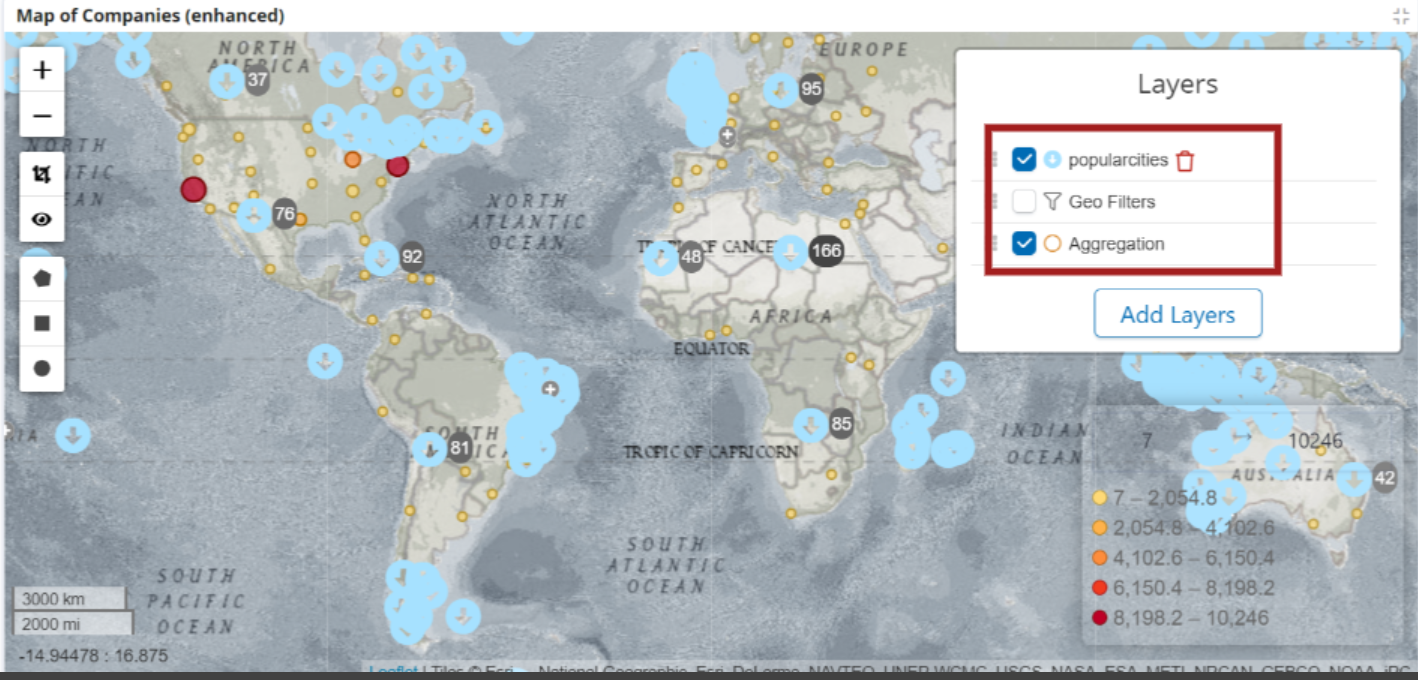
The Layer Control is located in the top-right corner of any Enhanced Coordinate Map. When clicked on, it allows you to toggle which layers are visible on the map.

Layers Control:
When the add layers button is clicked, a list of available Stored Layers (i.e. the GeoJSON that we imported in the previous section) can be added to the map (below). Once the populated places (GeoJSON uploaded to ES) Stored layer is selected, click Add and Display to add the selected layer onto the map and to make it visible. If you are loading many layers, the Add option might be useful, as the layers are only rendered if they are visible.

Layer Ordering:
Layers are drawn on the map in the same order they are in the Layer Control (points always show in front of other layers). Layers can be ordered by clicking the drag handle to the left of any checkbox and dragging them to the desired position.

Marker clustering:
Marker clustering is a method that allows all points on that particular layer to be represented at once. It is used by Point of Interest and Stored Layer types.
The populated_places Stored Layer appears as below on the Map. As the layer is large it is showing the areas where there are higher densities of points as Marker clusters with a number representing the amount of points that the cluster represents:
In the areas where there are lower point densities, but still contain overlapping points, grouping happens. You know they are grouped because there is a + to the right of the marker. These can be ‘exploded’ by clicking on them, which is also known as Spiderfying.
![]()
Point of Interest (POI) Layers:
POI layers are useful for representing other searches (that contain a geo_point or geo_shape type) on the map. In this example, we are using the companies index to represent a Point of Interest layer on the Map.

Selection tools to create geo-filters:
For all selection tools, a geo filter is created.

Applying Geofilters when there is a POI layer (with the apply filters option set to true). Notice that Aggregation and POI layers are filtered
You can apply multiple geo-filters on the same Map.

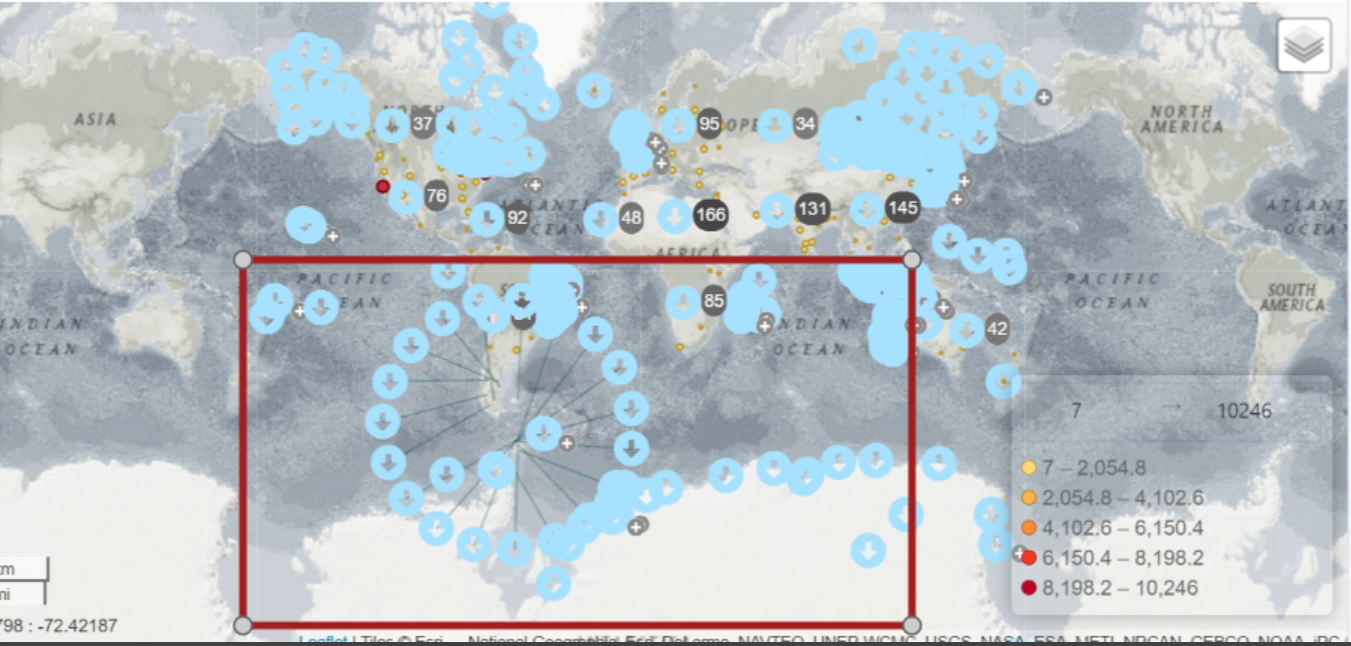
Multiple Geo-filters:
Below, the Aggregation layer gets filtered with the applied Geo-filter, while all populated places remain.
![]()

Conclusion:
Finally, if you want to explore the Siren dashboard with the map yourself, feel free to download the Siren Platform Demo Data and explore the Enhanced Coordinate Map in Siren.